Analysing Average House Prices by Postcode
House prices are always in the news. Whether there is a property market crash, a downturn in the economy or a debate about housing stock; average house prices are often used as a barometer of the current state of the economy - even if this can be misleading!
For businesses looking to market products to a defined audience or target sales activity to the most profitable areas, house prices can play an important part in refining that strategy.
A Measure Of Household Wealth
Houses are the largest component of wealth for the majority of households in the United Kingdom.
And it goes without saying that, in general, the larger and more expensive the property, the higher the household income required to make the mortgage or rental payments.
Of course care should be taken to equate house price to disposable income. The income of many households is now stretched and a higher percentage of income than ever before is being used to fund the mortgage or rental payments on property.
All Properties Are Not Equal!
Of course, there are huge price fluctuations across the country and the average price of a similar type of house in different parts of the country can vary wildly.
As we all know, detached properties are more expensive than terraced and properties in the North of England are more expensive than the South East.
As an example, according to the Land Registry data for Q2 2016, a detached house near Preston in Lancashire will, on average, cost around £270,000. Purchase a similar detached house near Harpenden in Hertfordshire and it will set you back in excess of £1 million!
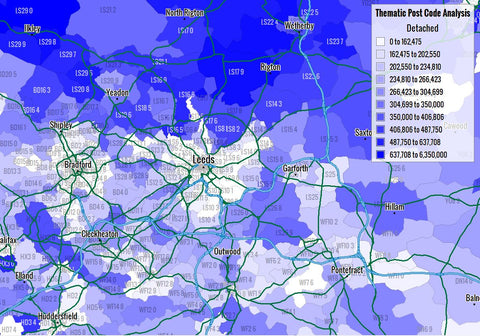
Fig 1: Average detached house prices across Leeds by Postcode Sector
But variations in prices are not just national or regional in nature.
The image above shows Postcode Sectors shaded by the average prices for detached properties for 2016 Q2 - the darker the blue, the higher the average price as indicated in the key, top right of the image.
Detached prices in the dark blue areas north of Leeds indicate averages up to £650,000+ whereas the areas to the South of Leeds are much lighter indicating typical prices much lower at around the £200 - £350k range.
Such differences can affect decisions such as where to promote high value luxury goods.
Identifying Product Demand
Understanding the local property markets can also help identify the demand for specific products and services.
For example, areas with high volumes of property transactions are more likely to have households looking for high value products such as white goods, furniture and carpets with which to furnish their new homes.
Equally, areas which have seen dramatic price increases in house value are likely to have homeowners more inclined to free up equity to purchase a new conservatory or extension.
Key Statistics
In analysing the average house prices for Q2 2016, we thought it would be fun to see which Postcode Districts topped the charts!
These figures only reflect sales made in Q2 2016 where at least one transaction took place.
Highest House Prices
|
Type |
Postcode District |
Average Price (£) |
|
Detached |
SW13 |
£5,000,000 |
| Semi-Detached | NW1 | £11,500,000 |
| Terraced | WC1N | £6,750,000 |
| Flat | W1G | £3,815,000 |
| Overall Average | W1G | £3,815,000 |
Lowest House Prices
|
Type |
Postcode District |
Average Price (£) |
|
Detached |
CF40 |
£75,667 |
| Semi-Detached | LL71 | £45,000 |
| Terraced | TS2 | £30,000 |
| Flat | BB6 | £19,000 |
| Overall Average | TS2 | £30,000 |
Licensing the Data
If you are a business interested in licensing the average house price data for England and Wales, you can find out more information on our Average House Price by Postcode product page.

