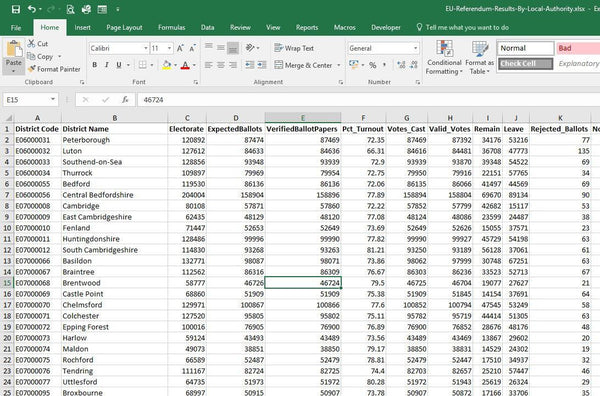
A free Excel spread sheet of the best available voting statistics and results for the EU Referendum at Parliamentary Constituency level.
This spread sheet is also included in our Postcode to Parliamentary Constituency lookup product and matching Excel spread sheet.
Background
For the EU Referendum on 23rd June 2016, Local authorities weren’t required to publish the results of the EU Referendum by Parliamentary constituency or by ward and, in most cases, they sub-divided their count process which removed the possibility to get ward or constituency breakdowns.
Nevertheless, some local authorities did publish the results by ward and Parliamentary constituency and Northern Ireland also published the results of the referendum for each of its 18 constituencies.
Referendum Results by Constituency Estimates
Because of the lack of local results for the EU referendum by Parliamentary Constituency, estimates published by Dr Chris Hanretty of the University of East Anglia are often used to analyse the results at constituency level. Dr Hanretty modelled the results by determining the relationship between the population demographics of local authorities and their referendum results, and then using this profile to project the results for each constituency based on the characteristics of its demographic profile.
Actual Referendum Results by Constituency
Subsequently, the BBC asked all local authorities in charge of counting the result in their area for voting figures broken down by ward. Of the 1,283 wards the BBC were able to collect data for, 857 of these could be transformed into 107 Parliamentary constituencies to give precise, known, voting figures for the referendum in that area.
Spread Sheet Contents
The included file contains the best available statistics for the EU Referendum at Parliamentary Constituency level and, in addition to the Constituency Code and Name, includes the following fields:
Leave%
This is the % of voters that voted Leave in the referendum from the best available source as indicated in the Source field (See below). As a result, the Leave% figures are the actual known figures where the source is BBC or NI (Northern Ireland). Where the Source is DrCH, these are estimates calculated by Dr Hanretty and therefore should be treated with caution, especially where the result was close.
Result
This is a summary of the result based on the Leave% figure. A Leave% figure of over 50% is Leave and below 50% is Remain.
Source
The source of the Leave% figure provided as follows:
BBC – The BBC research. BBC, Local voting figures shed new light on EU referendum, 6 Feb 2017
DrCH – Dr Chris Hanretty. Chris Hanretty, Revised estimates of leave vote share in Westminster constituencies, 18 August 2016
NI – Northern Ireland published results. BBC, EU referendum: How Northern Ireland constituencies voted


